Research

ATLAS OF COMETARY SPECTRA   

by C.Arpigny, F.Dossin, A.Woszczyk, B.Donn, J.Rahe, S.Wyckoff
(to be published by Springer in the series Astrophysics and Space Science Library, 2012)

This web site presents a set of sample plates from the electronic version of the forthcoming Atlas of Cometary Spectra in order to show the type of material contained in this atlas and to provide the opportunity to appreciate the quality of the spectra reproduced therein.

We also include below the Table of contents of the atlas as well as a few brief comments related to the various illustrations.

Description of the Atlas

This Atlas of Cometary Spectra has been compiled as a sequel to the well-known "Atlas of Representative Cometary Spectra" published by Swings and Haser in 1956, which illustrated low-resolution spectra available at that time. The new atlas comprises some 400 reproductions of cometary spectra secured in the world's largest observatories during the three decades or so from the passage of comet Mrkos 1957 V, for which the very first high-dispersion spectrum was taken, to the return of Halley's comet. A few additional spectra of more recent comets are included, which were acquired with the Hubble Space Telescope and with the Very Large Telescope at the European Southern Observatory. The illustrations refer to over 40 different comet apparitions; they are grouped into a set of 200 plates, approximately two thirds of which reproduce photographic spectra, while the rest give examples of spectra recorded electronically.

Spectral features are identified on every plate and various sections provide, in particular, intercomparisons showing the similarities and differences among the spectra of comets, as well as illustrations of the atomic and molecular emissions reproduced at large scale. The high-resolution scans of the spectra included in the electronic version of the atlas, allowing researchers to study the spectra in great detail, will be widely welcomed.

The main purpose of this atlas is to document in detail the vast amount of information contained in the spectra of comets, especially at high dispersion, thus providing an extensive body of reference for studies in this field. At the same time, it illustrates the tremendous progress which was achieved in cometary spectroscopy during the period covered, mainly thanks to the use of high-resolution spectrographs and large telescopes, as well as due to the considerable extension of the observed wavelength range, and the advent of electronic detectors.


(Palomar Mtn. Obs., Obs. de Haute-Provence = OHP, Lick Obs.)


Table of contents

PREFACE
ACKNOWLEDGEMENTS
GENERAL INTRODUCTION

1. A brief introduction to comets
    1.1. Comet discoveries and designations
    1.2. Comet brightness
    1.3. Comet orbits
    1.4. The nature of comets
            1. The nucleus
            2. The coma
            3. The tails
            4. Comet spectra
                i. Brief description .........T.1 (Observed species)
                ii. The excitation mechanisms of the discrete emissions
                iii. Spatial distribution of the neutral species
            5. Chemical composition
                i. Molecular abundances ......T.2a
                ii. Elemental abundances ......T.2b
                iii. Isotopic ratios
            6. Origin and evolution of comets
                i. The Oort cloud and the Kuiper belt
                ii. New and old comets
                iii. The fate of comets in the planetary system
    1.5 General bibliography

2. Developments in cometary spectroscopy since 1957
     T.3 (Example of development in near-IR spectroscopy)

3. Identification of cometary emissions
     T.4 (List of all atomic and molecular transitions
             identified in comet spectra)

4. Description of the Atlas
     T.5a (Orbital data)
     T.5b (Photometric data)
     T.5c (Plate index)
     T.6 (Observational data)
     T.7 (List of comets according to heliocentric
             distance intervals)
     T.8 (Correspondence of old- and new-style designations)

Part I
PHOTOGRAPHIC SPECTRA

Introduction

Ia - Overview. Intercomparisons
    Plate captions
Ib - Evolution with heliocentric distance
   Plate captions Ib-04

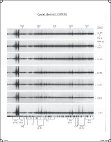
Evolution with heliocentric distance r
Bennett (1970 II) from r = 0.57 to 1.07 a.u. 381-434 nm
(OHP, European Southern Obs. = ESO)
Ic - Individual spectra
   Plate captions 
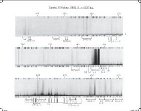
Ic-24

Individual comet
1P/Halley r = 0.97 a.u. 332-432 nm
(ESO)
Id - Tail spectra
   Plate captions 
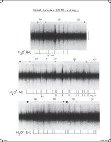
Id-10

Tail emissions
Kohoutek (1973 XII) r = 0.46 a.u. 613-712 nm H2O+ (3 bands)
(Lick)
Ie - Molecular emissions
   Plate captions 
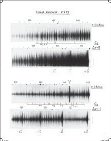
Ie-11

Molecular emissions
Kohoutek (1973 XII) r = 0.46 a.u. 486-517 nm C2 Dv = 0
Kohoutek (1973 XII) r = 0.52 a.u. 534-564 nm C2 Dv = -1
(Lick)
If - Atomic emissions
   Plate captions 
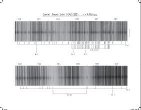
If-08

Atomic emissions
Ikeya-Seki (1965 VIII) r = 0.063 a.u. (~14 solar radii) 379-401 nm Ca+, Fe, Ni, Co, CN
(Kitt Peak National Obs.)
Ig - Velocity effects
    Plate captions
Ih - Intensity tracings
    Plate captions
Ii - Instrumental and atmospheric influences
   Plate captions Ii-06

Instrumental influence : increase in resolution CH A-X (0-0)
Ikeya (1963 I) r = 0.72 a.u. (OHP)
West (1976 VII) r = 0.47 a.u. (McDonald Obs.)
Wilson (1987 II) r = 1.22 a.u. (ESO)
Notice also the "Swings effect" : different relative line intensities at different dr/dt 's

Part II
ELECTRONICALLY RECORDED SPECTRA

Introduction

IIa - Vacuum ultraviolet : 120 - 300 nm
     T.IIa-1 and IIa-2 (List of spectroscopic observations of comets, pre-IUE and with IUE, respectively)
   Plate captions 
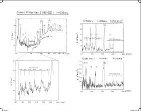
IIa-16

Vacuum ultraviolet H, C, O, S, CO
1P/Halley (1986 III) r = 0.84 a.u. 140-200 nm (IUE)
103 P/ Hartley 2 (1991 XV) r = 0.96 a.u. 120-680, 180-230 nm (HST)
IIb - Optical wavelength region : 300 nm - 1 µm
   Plate captions 
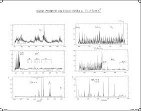
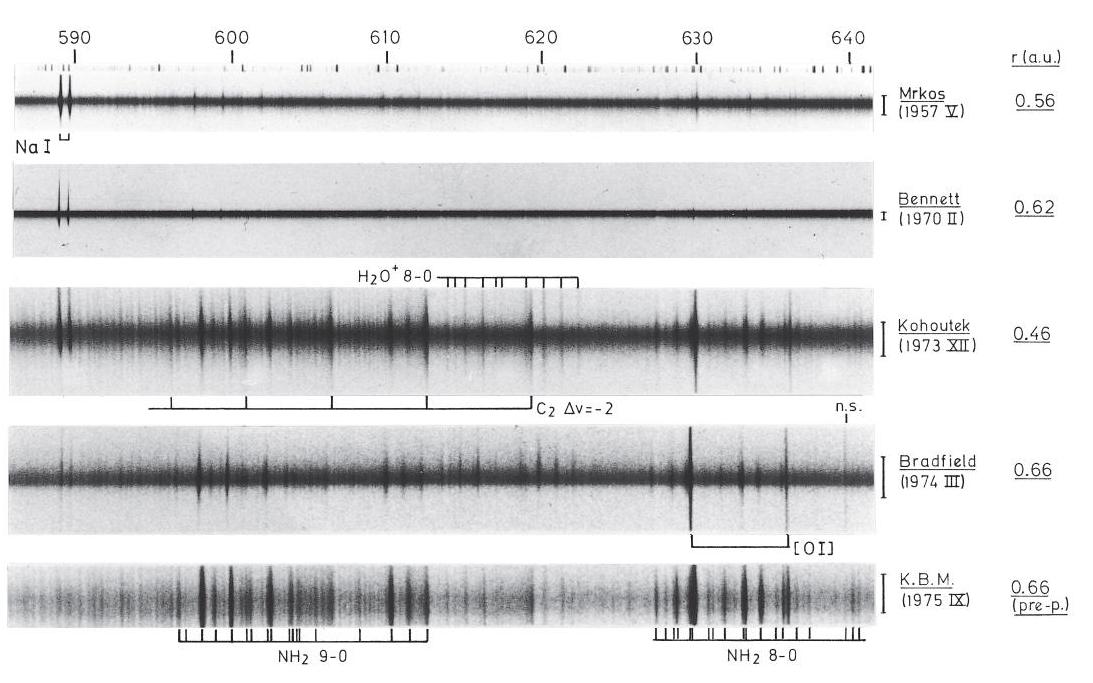
IIb-32

Optical region C3, CN, CH, C2, NH2, CH+
122P/1995 S1 (de Vico) r = 0.66 a.u. 401-408, 421-433, 550-577 nm
(McDonald)
IIc - Infrared : 1 - 20 µm
     Plate captions
IId - Radio wavelength region : > 0.3 mm
   Plate captions 
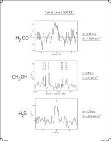
IId-08

Radio region H2CO, CH3OH, H2S
Levy (1990 XX) r = 1.36, 1.32 a.u. 1.33, 2.07, 1.78 mm
(Institut de Radioastronomie Millimétrique = IRAM)

     References

     Index


| Home | Publications | People | Teaching | Pictures | Links |